Gold Price Analysis: Key Levels to Watch Today (16 Sep 2026)
Gold jumps to $4325.50 on tariff fears. Read our beginner-friendly analysis of the key support and resistance levels to watch today.
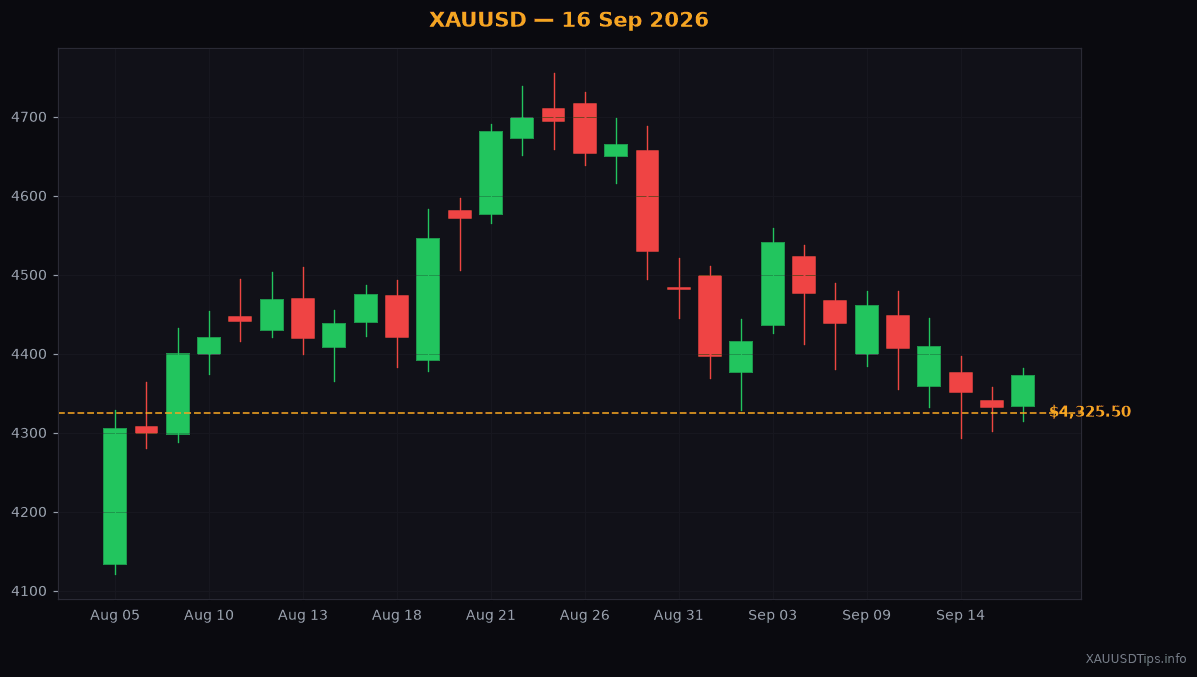
Did you see the charts this morning? The gold spot price is sitting at $4325.50 right now. That is a solid jump of $38.60 today.
If you are trying to learn how this market works, today is a perfect classroom day.
First, let us look at the world around us. Why is the price moving like this?
Donald Trump just threatened a new ten percent tariff on China. A tariff is a tax on goods coming into a country.
This news made investors very nervous. When investors get scared, they sell their risky assets.
Look at Bitcoin today. It slipped down to $94000.00 because of these tariff fears.
At the same time, Deutsche Bank says the US economic outlook is murky. Murky is just a fancy word for confusing and unpredictable.
When the future looks confusing, traders do not want to hold risky assets. They want something safe.
They run to gold. This is why we see the price rising today.
If you live in Pakistan, India, or the UAE, you might feel this price rise in your daily life. Local jewelry shops in Karachi and Mumbai base their rates on this global spot price.
When the global price jumps, local currency rates like the PKR or INR usually struggle. This makes gold jewelry much more expensive for local families.
Today's Key Technical Levels
Now, let us look at the technical charts to plan our next move.
Recently, the price of gold fell. But it stopped falling when it hit a support zone between $4286.00 and $4276.00.
Let us explain support. Think of support as a solid wooden floor in a house. You drop a ball, it hits the floor, and it bounces back up.
That floor held beautifully. Because the floor held, the price is now correcting higher.
A correction is just a temporary price move against the main trend. Since the recent move was down, the correction is taking us up.
So, how high can this bounce go today?
We need to look for the next ceiling. In trading, we call this ceiling a resistance level. It is a price point where sellers usually wait to push the price back down.
Our first big ceiling is resistance A. It sits between $4373.00 and $4362.00.
I think this is the most important zone to watch today.
How to Trade This Setup
If the price reaches this ceiling, sellers might jump in. This could push the price back down.
If you want to trade this setup, you could look to sell near this $4373.00 ceiling.
If the price starts falling from there, your first target to take profit would be $4313.00.
Take profit is an order you set to automatically close your trade and secure your gains.
If the selling pressure is very strong, the price could even drop to $4253.00.
But what if the price does not stop at the ceiling? What if it breaks right through?
If gold breaks above $4373.00, it means the buyers are very strong. It could climb much higher.
The next target would be resistance B. This is a higher ceiling between $4433.00 and $4417.00.
Because of this danger, you must always protect your account. You must use a stop loss.
A stop loss is an automatic safety net. It closes your trade if the price goes too far against you.
For this sell trade, a stop loss around $4400.00 makes sense. If the price hits that level, it means our ceiling did not hold.
Trading is all about managing risk, not guessing the future perfectly.
Keep an eye on the news today. The market is very jumpy, and things can change fast.
Written by XAUUSDTips Team. Not financial advice. Trade at your own risk. Technical levels partially referenced from LiteFinance analysts.
XAUUSDTips Editorial
Published September 16, 2026