Gold Slips Today: Learning Floors and Ceilings
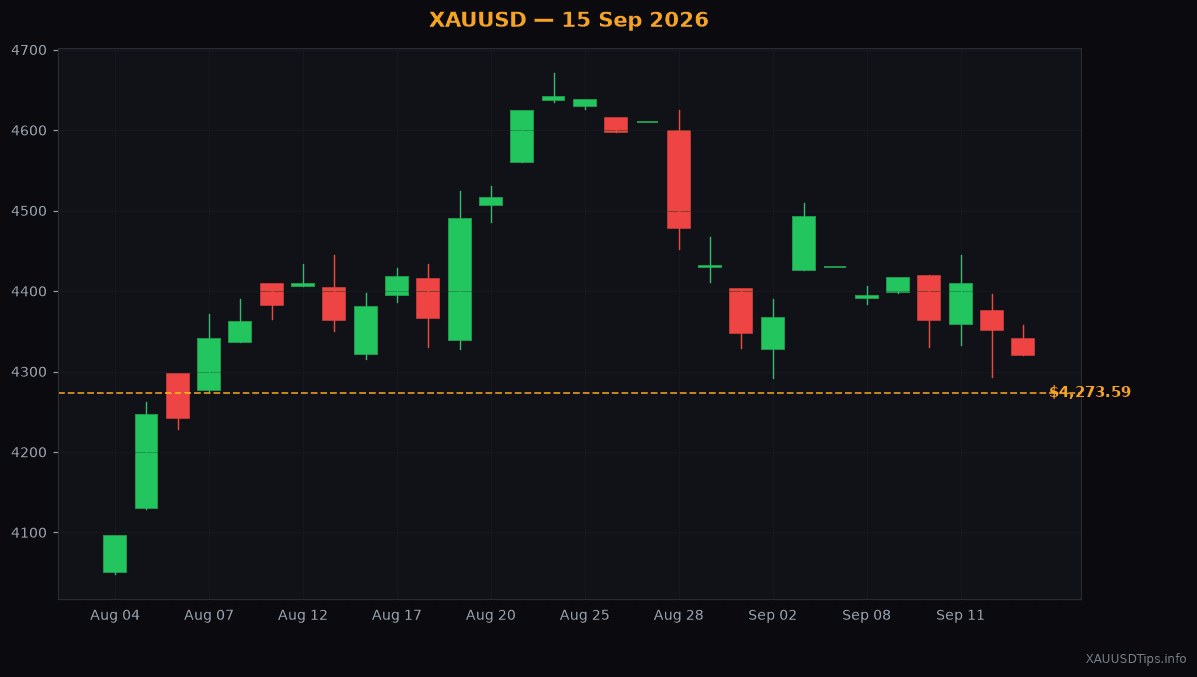
Gold dropped to $4273.59 today. Let us learn how floors and ceilings can help you understand these big market moves.
Hey there. If you opened your trading app today on September 15, 2026, you probably noticed a lot of red. Gold is sitting at $4273.59 right now. It fell by $30.90 today. If you are tracking jewellery rates in Pakistan or India, this drop will definitely make waves in the local bazaars soon.
Why is this happening? Global markets are feeling quite shaky. We are still seeing the ripple effects of tariff announcements and nervous investors. When big countries threaten new taxes on imports, everyone gets a bit scared. Even digital assets like Bitcoin have been slipping lately.
When markets get messy, we need simple tools. Today, I want to teach you one basic concept. This tool will help you make sense of any chart. It is the concept of support and resistance. Understanding these floors and ceilings is the first step in gold trading.
Floors and Ceilings
Let us start with support. Support is a price level where gold usually stops falling. Imagine a solid wooden floor in your house. You drop a tennis ball, and it hits the floor and bounces up. The floor stops the ball from falling into the basement.
In the market, support happens because buyers think a price is cheap. They all rush in to buy at that specific number. Today, many traders were watching the floor at $4282.00. But guess what? The price fell right through it.
This brings us to resistance. Resistance is a price level where the price struggles to go higher. Think of this as a concrete ceiling. You throw the tennis ball up, it hits the ceiling, and it bounces back down.
Why does a price stop at a ceiling? It is because sellers think the price is too high. They start selling their gold to lock in profits. This selling pressure pushes the price back down.
Here is a neat trick that happens all the time. When the price breaks through a floor, that old floor often becomes a new ceiling. Traders call this a role reversal. Since gold broke below the $4282.00 floor today, that level might now act as a ceiling if the price tries to go back up.
Using This Knowledge
As a beginner, you might feel tempted to sell right now at $4273.59. But jumping in after a big drop is often risky. What if the price suddenly bounces?
Instead, smart traders wait for a pullback. A pullback is a temporary rise in price against the main downward trend. It is like the price taking a quick breath before sliding down again.
You want to wait for the price to climb back up to a known ceiling. For example, some analysts point to a resistance zone between $4373.00 and $4362.00. If gold climbs back to that area, it might be a safer spot to place a sell order.
If you do sell near that ceiling, where do you exit? You could target a lower floor, perhaps around $4253.00.
But what if you are wrong? The market is unpredictable. I always worry about sudden moves. That is why you must use a stop loss. A stop loss is an automatic instruction to close your trade if the price moves against you. It is your emergency safety net. For this trade, you might set a stop loss at $4400.00.
Think about this next time you visit a local gold market in Karachi or Dubai. The physical gold price you pay for jewellery is based on these exact chart levels. Understanding these floors and ceilings gives you a massive advantage, whether you are buying a ring or trading online.
Take your time to study these lines on a clean chart today. Do you see the floors and ceilings? Let me know if you can spot them.
Written by XAUUSDTips Team. Not financial advice. Trade at your own risk. Technical levels partially referenced from LiteFinance analysts.
XAUUSDTips Editorial
Published September 15, 2026