Gold Market Weekly Review: Today's Outlook for 02 Oct 2026
A friendly look at this week's gold price action, the impact of new tariffs, and key levels to watch for Monday.
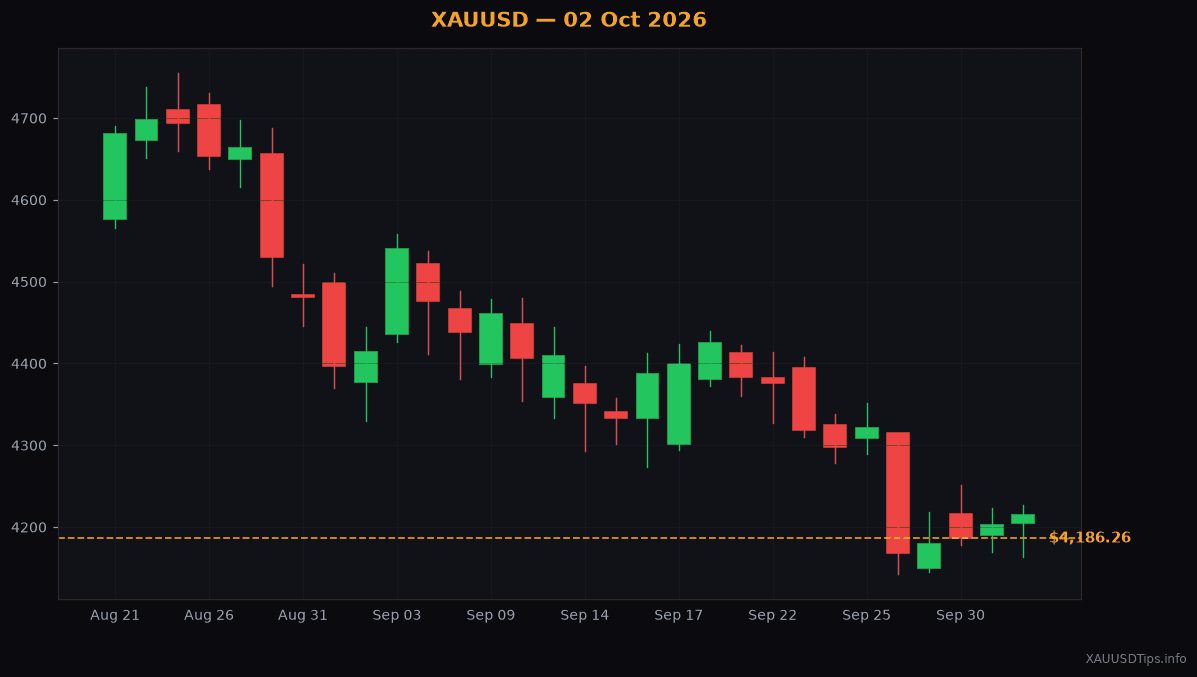
Hey there. We finally made it to Friday, October 2, 2026. I am looking at my screen right now, and gold is sitting at $4,186.26. That is a small gain of $12.00 today. It feels like a quiet end to a very noisy week, doesn't it? If you are practicing gold trading in Karachi or Mumbai, you know how stressful these swings can be. Especially when you are trying to figure out if you should buy now or wait for a bigger drop. Let us look back at what happened this week. That way, you can prepare your game plan for Monday.\n\n## Why the Market Felt Shaky This Week\n\nWe had a lot of drama over the last few days. The biggest news was about tariffs. President Trump threatened to put an extra ten percent tax on goods coming from China. This made investors nervous. When people get scared, they sometimes run to gold. But they also run to cash.\n\nWe also saw Bitcoin take a hit recently, slipping down as people got worried. Even big banks like Deutsche Bank are saying the global outlook is quite murky right now. All of this news creates a lot of noise. It is easy to get lost in the headlines. But as retail traders, we need to focus on what the charts are actually telling us. Let us look at the price levels that matter.\n\n## Understanding the Ceilings and Floors\n\nTo make sense of the charts, we need to talk about support and resistance. Resistance is like a sturdy ceiling. It is a price level where gold usually struggles to go any higher because sellers start dumping their metal. Support is like a strong wooden floor. It is a price level where the falling price usually stops because buyers jump in.\n\nThis week, the sellers really defended the ceiling between $4,213.00 and $4,223.00. Because they defended this area, the price started falling. On Tuesday, September 30, the price dropped to our first floor near $4,167.00.\n\nWhy do we look at these specific numbers? When big institutional traders see a price like $4,213.00, they place massive sell orders. As a beginner, you do not want to fight these big players. You want to ride the wave they create. If they are pushing the price down toward $4,110.00, trying to buy right now is like standing in front of a moving train. It is usually safer to follow the trend until we see a real sign of a reversal.\n\nRight now, the price bounced back up to $4,186.26. I think this might just be a temporary bounce. The overall trend for the short term still looks downward to me. If the price creeps up toward $4,193.00, it might be a good spot to look for selling opportunities. The next big floor we are watching is all the way down at $4,110.00.\n\n## How This Affects Your Monday Plan\n\nSo, what should you do when the market opens on Monday? If you already have active trades from the ceiling at $4,213.00, you might want to hold them. You could aim for that lower floor of $4,110.00. Just remember to protect yourself.\n\nYou can move your safety exit point, which we call a stop-loss (an automatic order to close your trade if the price goes against you to prevent big losses), to your entry price. This is what we call a breakeven trade. This means even if the market turns against you, you will not lose any money.\n\nFor my friends in Pakistan checking the local PKR jewellery rates, this slight downward trend might give you a better buying window soon. But do not rush. The market is very moody right now. Let us see if Monday brings more tariff talk or if things calm down. I will be watching that $4,193.00 level closely.\n\nWritten by XAUUSDTips Team.\nNot financial advice. Trade at your own risk.\nTechnical levels partially referenced from LiteFinance analysts.
XAUUSDTips Editorial
Published October 2, 2026