Understanding Gold Target Zones Today: 27 Oct 2026
Learn what target zones are in gold trading and how to use them when prices fall today.
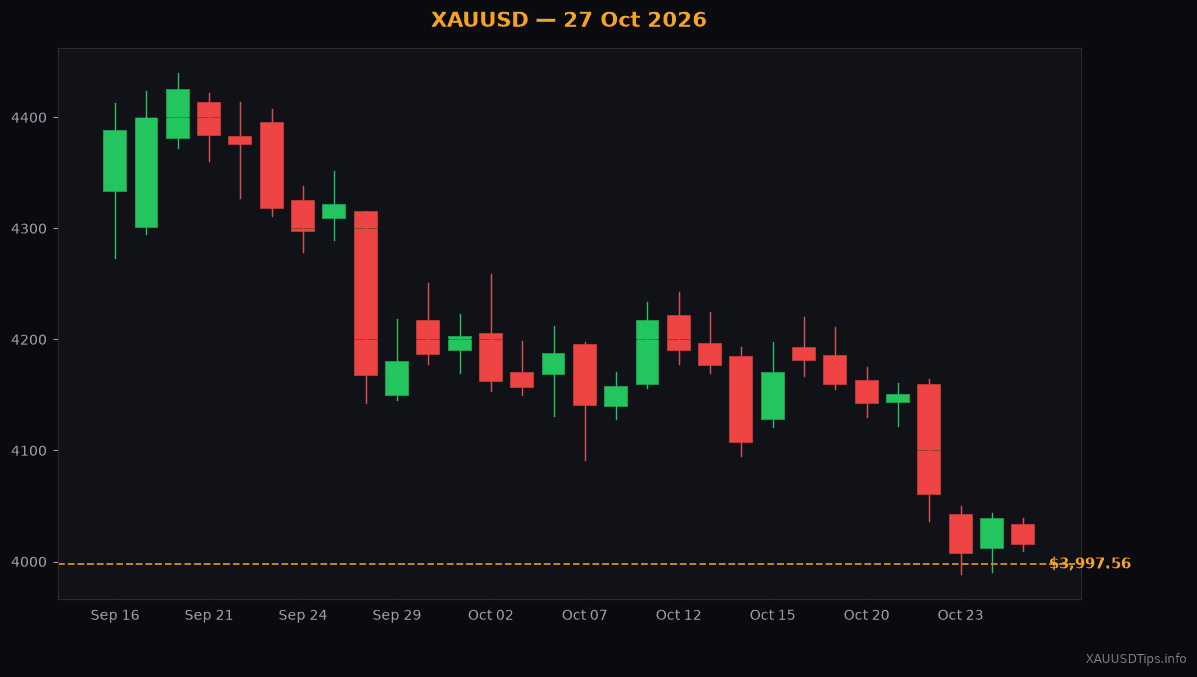
Gold dropped by $22.30 today, bringing the price down to $3997.56. If you are watching the charts right now, you might feel a little confused. News feeds are buzzing with headlines about tariff threats from Donald Trump and wild moves in cryptocurrency, but gold is simply quietly sliding downward.
When prices drop like this, beginners often panic. You might wonder if you should buy immediately because it looks cheap, or sell because you fear it will fall forever. Today, I want to teach you a simple tool that professional chart watchers use to handle these moments. It is called a target zone.
What Is a Target Zone in Trading?
Think of a target zone like a planned pit stop on a long road trip. If you drive a car from Lahore to Islamabad, you know you will likely stop at specific rest areas along the highway to refuel. You do not stop at random spots on the road.
In gold markets, price moves in a similar way. A target zone is a calculated price range on a chart where buyers or sellers are expected to step in. It is not just one exact number. Instead, it is a narrow band of prices.
Why do analysts use a price range instead of a single price tag? Because thousands of traders around the world in Dubai, Karachi, and London are all watching slightly different indicators. A zone accounts for small differences in their orders.
How Target Zones Help You Make Decisions
Right now, gold is in a short-term downtrend (a temporary period where prices keep making lower highs and lower lows). Analysts see the current downward slope heading toward a key target zone between $3957.00 and $3978.00.
What happens when price reaches this area? Two main things can occur:
First, the falling price might slow down and bounce back up. Buyers sitting in that zone step in to buy gold, pushing the price back toward higher resistance levels (a price ceiling where gold struggles to climb higher, like $4078.00 to $4088.00).
Second, if selling pressure is very strong, the price might break right through that floor. If gold pierces below $3957.00, it opens the door for a deeper slide toward the next lower level, often called a secondary target or gold zone around $3865.00 to $3875.00.
Knowing these zones keeps you calm. Instead of guessing, you wait to see how price behaves when it hits the rest stop.
A Practical Example for Today's Market
Imagine you want to trade today's move. Gold is sitting at $3997.56. It is floating between the upper ceiling at $4078.00 and the floor at $3978.00.
If price rallies back up toward resistance between $4078.00 and $4088.00, some traders look for sell setups there. They aim for profits near $4031.00 or down at $3975.00. To protect their account, they place a stop loss (an automatic order that closes a trade to limit loss if you are wrong) just above $4113.00.
If you are a beginner watching jewellery gold rates in Pakistan or the UAE, understanding these spot moves helps you understand local prices too. When international spot gold drops toward $3957.00, local per-tola prices usually follow shortly after.
How to Start Using Zones as a Beginner
You do not need complex math to start seeing target zones. Here is a simple step-by-step way to practice:
Do not rush into real trades right away. Spend a few weeks marking these zones and watching price bounce or break. It will change how you view everyday market noise.
Written by XAUUSDTips Team. Not financial advice. Trade at your own risk. Technical levels partially referenced from LiteFinance analysts.
XAUUSDTips Editorial
Published October 27, 2026