Gold Technical Analysis Today: Key Levels for September 2
Gold jumps to $4323.32 amid Middle East tensions. Discover the key support and resistance levels to watch today.
Today is Wednesday, September 2, 2026. The spot price of gold sits at $4323.32 right now, up by $20.50 since yesterday. Tensions in the Middle East are rising again, causing risk aversion in the markets. Risk aversion simply means investors get scared and run to safer assets like gold. Have you noticed how local jewelry shops in Karachi, Mumbai, or Dubai react when global news gets tense? Prices shoot up fast because everyone wants a safe haven to protect their wealth.
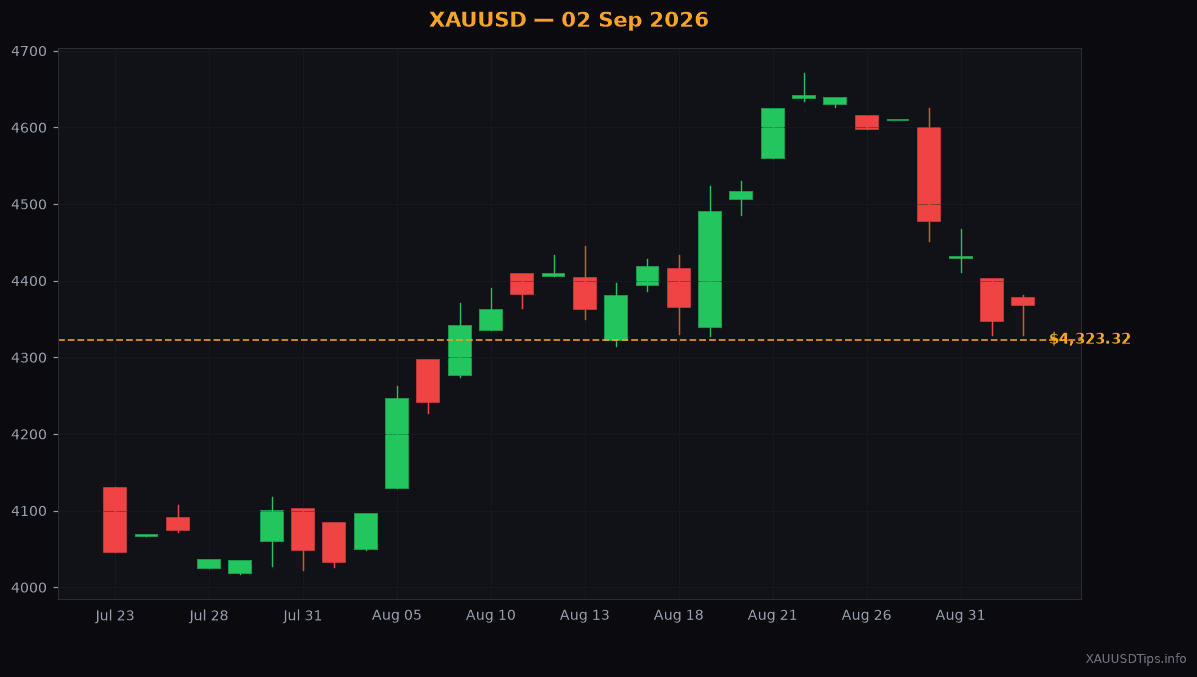
Let us look at the charts to see what is happening today. Recently, the price took a sharp dip. It dropped all the way to a level between $4,286 and $4,276. We call this a support zone. Think of a support zone as a strong wooden floor in a house. When the price falls and hits this floor, it usually stops falling and bounces back up. That is exactly what happened today. The buyers defended this floor and pushed the price up.
Because the floor held, we are seeing what traders call a corrective rally. A corrective rally is just a temporary move upward after a big drop. It is like a rubber band snapping back after being pulled too hard. Right now, the price has climbed back up to $4323.32. But where is it heading next? To find out, we need to look at the ceiling above us.
If this upward move keeps going, we might see the price head toward a major resistance level. This resistance area sits between $4,395 and $4,385. Resistance is like a low ceiling in a room. When the price rises and hits this ceiling, it often struggles to go any higher. Sellers like to wait at this ceiling to push the price back down. If you are looking to buy, you must be very careful near this ceiling.
If you see the price reach that ceiling of $4,395 to $4,385, it might be a good place to look for selling opportunities. I think many big sellers will wait there to enter the market. If they successfully push the price down, the first target could be around $4,338. If the selling gets even stronger, the price might fall back to today's low near $4,282. This gives us two clear targets to watch for potential profits.
But what if the price breaks right through the ceiling? That can happen when buyers get very aggressive due to global panic. If it climbs past $4,420, the sellers will likely give up. In trading, we use a stop loss to protect our money. A stop loss is an automatic order that closes your trade if the price goes against you. Setting a stop loss just above $4,420 is a smart way to manage your risk. It keeps a small mistake from turning into a big disaster.
For our friends in India, Pakistan, and the UAE, keep an eye on your local currencies today too. The Indian Rupee is holding its ground despite hawkish bets on the US Dollar. When the US Dollar gains strength, it can sometimes put pressure on commodity prices. This makes the moves even more unpredictable for local traders buying physical gold. Always check the global charts before you make any big decisions at your local bazaar.
Are you planning to trade today? If so, my advice is to wait for the price to reach these key zones. Don't chase the price in the middle of nowhere. It is much safer to wait for the market to come to your levels. Patience is your best friend when the market is this jumpy.
Let us summarize the levels we are watching today. The floor is at $4,286 to $4,276. The ceiling is at $4,395 to $4,385. Our main targets if the price turns down from the ceiling are $4,338 and $4,282. Keep these numbers written on a notepad on your desk.
Written by XAUUSDTips Team. Not financial advice. Trade at your own risk. Technical levels partially referenced from LiteFinance analysts.
XAUUSDTips Editorial
Published September 2, 2026