Gold Weekly Outlook 12 Oct 2026: Key Levels to Watch
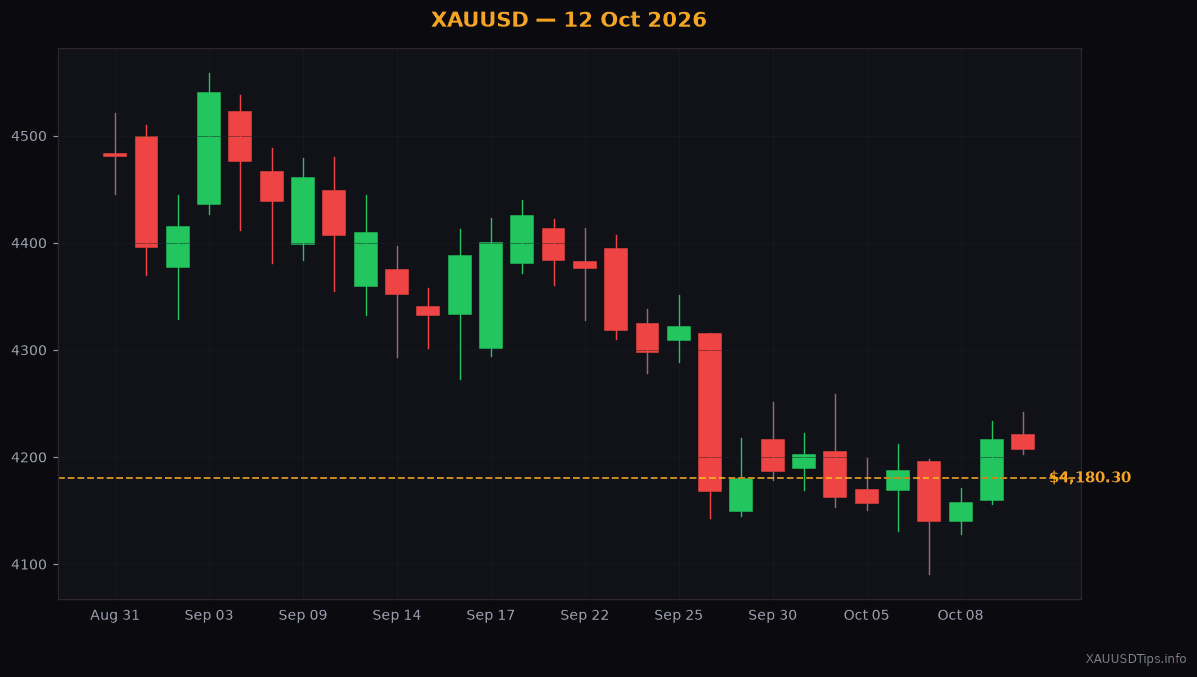
Gold sits at $4180.30 today. Here are the key support and resistance levels to guide your trading strategy this week.
Gold slipped by $8.60 today, bringing the live price to $4180.30.
Are you wondering why the chart feels so jumpy this morning? Fresh news about US tariffs created ripples across global markets. When big trade announcements happen, investors shift their cash around fast.
If you check physical markets in Pakistan, India, or Dubai today, buyers are sitting on their hands. Local prices in PKR and INR track global ticks. Many families prefer to wait when gold turns shaky before buying for upcoming weddings.
Let us look at the chart together so you can plan your trades for the week ahead.
Why Is Gold Facing Downward Pressure?
Market news is giving gold a bumpy ride right now. Recent statements about new US import tariffs created nervousness. When global trade gets tense, the US dollar usually gains strength.
A stronger US dollar makes gold more expensive for traders holding other currencies. At the same time, traders are watching the Federal Reserve (the central bank of the United States that controls interest rates).
When interest rate expectations stay high, non-yielding assets like gold lose a bit of shine. That explains why gold is struggling to climb today.
The Big Picture on the Chart
Right now, gold is trading inside a short-term downtrend. A downtrend simply means prices are forming lower highs and lower lows on the chart.
Gold tried to bounce back earlier today, but buyers ran out of steam quickly. They could not push price high enough to touch upper levels.
When buyers fail to push price up, sellers remain in control. That gives us clear levels to watch this week.
Key Resistance Levels to Watch
First, let us look at resistance (a price level where gold usually stops rising — like a hard ceiling holding price down).
Our main resistance zone for this week sits between $4,220.00 and $4,235.00.
If gold rallies into this $4,220.00 to $4,235.00 range, watch price action carefully. If price gets stuck there and shows sell signals, sellers may push it back down.
What happens if gold pushes cleanly past $4,235.00? In that case, the short-term downward trend is likely over. A break above $4,235.00 signals that buyers are taking charge again.
Support Targets Below Today's Price
Now let us discuss support (a price floor where buyers usually step in to stop gold from falling lower).
If sellers reject gold at our resistance zone, where could price go next?
Your first target on the downside sits at $4,150.00. That level acted as a floor in past trading sessions.
If sellers break past $4,150.00, the next target area is near $4,066.00.
These support targets are ideal spots for a take profit order. A take profit order is an automatic command that closes your trade to lock in earnings when price hits your goal.
Setting Up Your Risk Safety Net
Never enter a trade without protecting your bank balance first.
If you decide to look for short trades near $4,220.00 or $4,235.00, set a stop loss (an automatic safety net that closes your trade if price goes against you).
A smart stop loss for this setup sits at $4,262.00. Placing your stop loss above resistance limits your loss if the market surprises you.
Trading without a stop loss is like riding a motor scooter in fast Lahore traffic without a helmet. It might go fine for a few minutes, but one mistake ruins everything.
How to Handle Your Strategy This Week
Be patient and let the market come to you. Do not force trades at $4180.30 right in the middle of nowhere.
Wait for price to test $4,220.00 above, or wait for it to reach $4,150.00 below. Clear patience protects your capital.
How are you planning your trades this week?
Written by XAUUSDTips Team. Not financial advice. Trade at your own risk. Technical levels partially referenced from LiteFinance analysts.
XAUUSDTips Editorial
Published October 12, 2026